How We Spent $1,000,000 in 6.5 Years: A Detailed Breakdown
Wow, we spent over $1 million.
I’m just as shocked as you are. Most of my ideas come from spur-of-the-moment questions. Besides, it’s not like we spend it all at once. The expense total (represented by our cash outflows) runs from January 1, 2019, through June 8, 2026. In a technical sense, the total gross expenses tally all the transactions that hit our accounts. That’s still a lot over that timeframe, but it’s a bit refreshing to see. I don’t think most people run their numbers to see what’s really happening in their finances.
For context, the median U.S. household spent an estimated $1.5 million in total expenditures from 1995 through 2026. This aggregate is based on historical, inflation-adjusted data from the U.S. Bureau of Labor Statistics (BLS) Consumer Expenditure Surveys, which tracked annual household spending scaling from around $35,000 in 1995 up to roughly $78,535 recently. This amount was paid off with about $2.4 million in income (inflation-adjusted).
Flying against the doom-and-gloom social media pundits, we are a long way from the proverbial Kansas. My wife grew up working class in Florida. While she wasn’t rich (by any stretch), her mom and dad worked to provide stability for their three kids. I, on the other hand, grew up Abject-Poverty adjacent. The type of poverty that was a stone’s throw away from toxic fumes, so much so that I don’t think I knew what fresh air was until I got to the US. To have spent a million over 6.5 years is likely equal to what our families spend in our first 20 years. With the intrigue brewing, what did we spend our money on?
And, yes, “the price is definitely going up.”
Table of Contents
The Biggest Expenses: Was It Worth It?
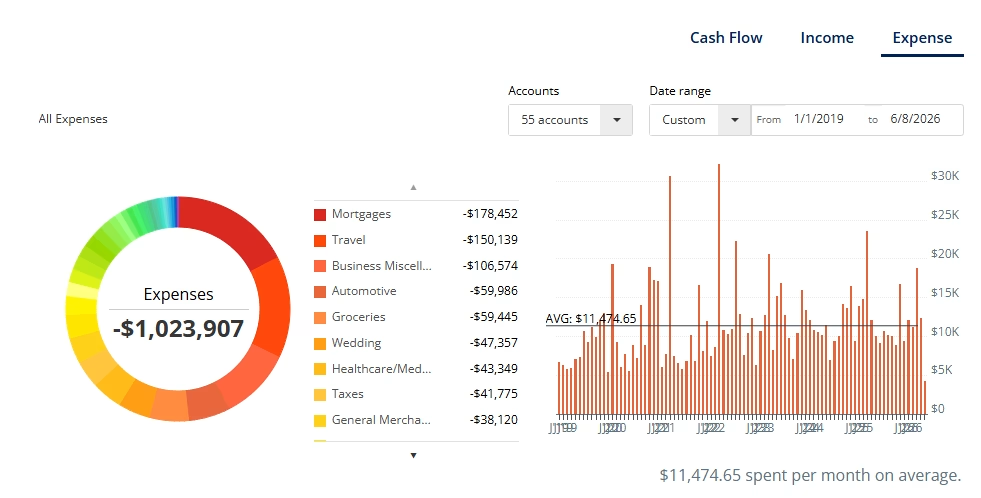
In total, we spent $1,024,000. Most of the million went to Maslow’s usual modern big three.
Similar to other US households, our cash outflow for Housing (including utilities, maintenance, and renovations) came in at $259,742; Automobile (including gas) at $64,510, and Food costs (including Groceries, Restaurants) came up to $68,808. These took the lion’s share with $393,060 (38 percent). On average, that’s a bit north of $60,000 per year. This is a great start since the big three eat up over 60% for most households that don’t track their finances.
Not-so-surprisingly, our travel expenses grossed $150,139 (15 percent, rounded up). Most of that is due to my wife’s travel taste, i.e., minimum 4-star hotels and some luxury dining. I guess I can take some blame since I technically plan the trips out. Since it’s a non-negotiable luxury item for us, I expected this one at around $23,000 average per year. It makes sense. We also tend to cover more than one country for about two weeks. One-week trips are limited since jet lag can burn them. Additionally, we take at least two trips a year, while the typical American family clocks in 3-4 international trips in a lifetime. This is definitely a luxury spend and not a NEED.
The often-forgotten business miscellaneous, i.e., the Rental Property expenses, and website hit us for $106,574. The business misc. is offset by the income side with +$91,219. This brings those expenses down to a manageable $15,355. To be fair, the other expenses also had their own offsets, rebates, reimbursements, etc. Since this isn’t a dissertation, let’s keep it surface where we can. Moreover, we use our income gingerly (see graphic #1).
Contrary to the Dave Ramsey approach, we opt to invest at least 25 of our gross salaries and then work through our financial goals. This way, we still make money off of our investments to offset our spending.
The Income that Pays the Millions in Expenses?
In the end, it’s still a lot of money over the last 6.5 years. That’s an average annualized expense of $157,524. Seriously, where did the money even go besides Travel? But more importantly, how did we pay for it all?
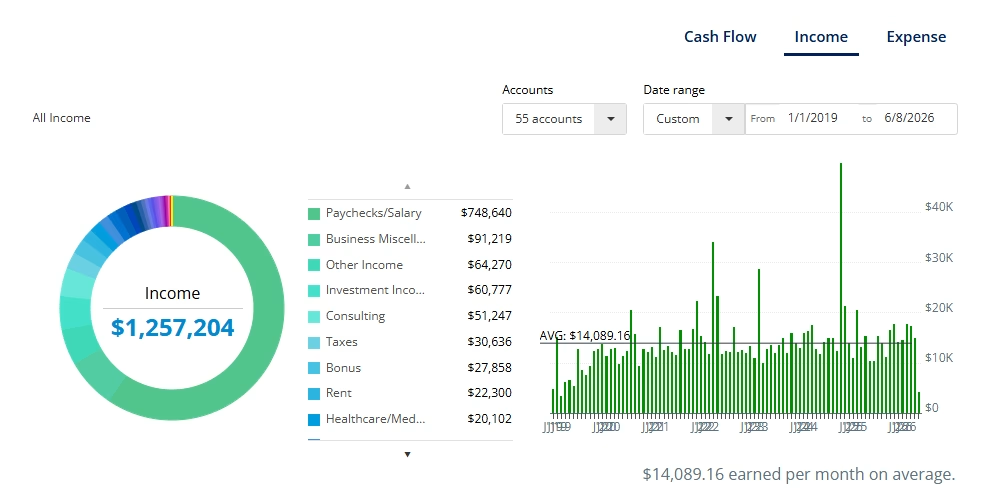
Based on the data pulled from Empower.com, we made money from multiple sources. The most jarring is that our combined paychecks and bonuses accounted for just 64% of our income [$799,887]. The rest came from all over, i.e., investment income, other income, consulting, taxes, rent, and even health care expense Reimbursements (see graphic #2 for details).
It hasn’t been easy, but where there were opportunities, we worked for them. Even now, I have to take a trip to clean the rental property. Once I touch down, it will be coffee and cleaning for at least 36 hours, and then flying back to resume regular 9-5 programming. The rental property brings in about $300 (net) monthly. At least, that 15-year mortgage is down to $32,500. Not too bad, considering that we got this back in 2017. Once that’s settled in 2028, we will be bringing in around $1,000 per month, which will be used to pay off the primary 2016 mortgage by 2032.
The better your cash inflow over time, the quicker you can invest more.
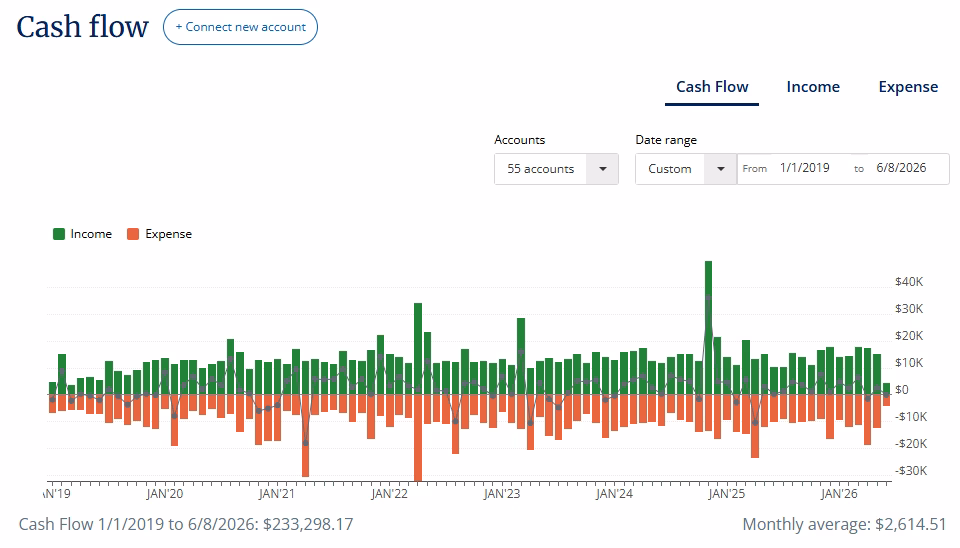
Million Dollar Cash Flow with $200k Remaining
To our credit, our average monthly cash flow has been north of $2,500, which is great. The rest of the heavier lifting for our net worth came from our investments. I theorize that life improves if you can maintain at least a $500 average positive monthly cash flow. By $5,000 montly, you will be financially free. Everything in between is wiggle room.
It’s honestly humbling since we didn’t come from wealth. Although we mess up and overspend, I can say we do the right thing right and are very consistent with our financial plan. Most people ask me what we did to get here; while that question is valid for verification purposes, it’s not the best takeaway question. The mindset matters more. My wife and I work, but we invest our money. We opt not to squander our time (money) on too many frivolous things. This doesn’t mean that we are perfect with money; we simply avoid death by multiple expenses that we can’t afford. It also helps that we aren’t popular, which requires that you stay trendy, which is expensive. Instead, we can find happiness reading our books or audiobooks.
In a sense, we are grounded people. It works for us, and so our money works for us too.


The Right Moves that Keep a Million at a Million
Modern times require a modern approach to safeguarding wealth.
Our saving grace is that we aren’t materialistic. We tend to favor cooking at home and cleaning ourselves vs paying others. Basically, we do the work rather than try to avoid labor. And we invest. This is key. A lot of people fall for the lifestyle creep trap. You can’t build wealth while playing make-believe aristocracy. You can make good money, but it’s not worth as much if you don’t know how to use it, i.e., manage taxes efficiently and capital gain generation.
Additionally, I think living in an affordable 2/2 condo [1,000 sq.ft] (which can feel cramped every once in a while) also helps. Our housing costs keep financial issues at a nominal level. We definitely aren’t cutting travel. We clocked in 20 countries and countless UNESCO spots. The medical expenses were insane for a while [$43,349], and the total wedding cost was interesting [$47.357]. Here’s the list of countries we visited so far:
| Year | Countries | Total Annual Travel Costs** | Highlights |
| 2019 | 13 | $10,029.13 | 12 Countries in Days: Ireland, Scotland, England, France, Netherlands, Brussels, Italy, Vatican, Monaco, Spain, Portugal, Iceland |
| 2020 | 0 | -$963.36 | Pandemic/Wedding |
| 2021 | 0 | $6,398.44 | Pandemic |
| 2022 | 3 | $24,589.49 | Canada (Quebec), Portugal (Lisbon) and Spain |
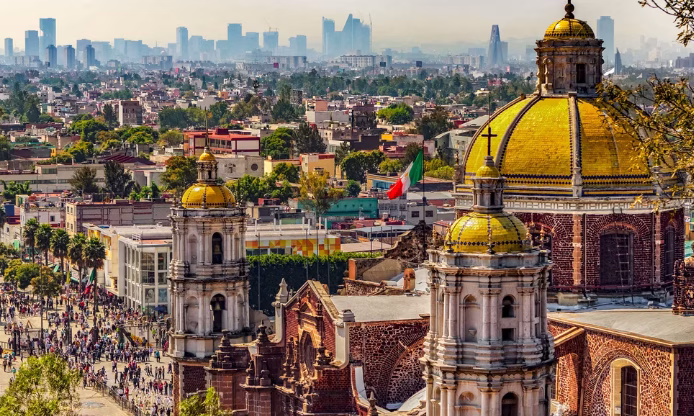
| 2023 | 3 | $24,326.25 | México (Yucatán), Argentina, and Brazil (Iguazu/Rio) |
| 2024 | 1 | $9,833.55 | Canada (Banff) |
| 2025 | 3 | $31,779.45 | Switzerland, Portugal (Porto), and Brazil (Rio, Salvador, Buzios) |
| 2026 | 3 | YTD $15,902.94 Est. $22,500 | Mexico (CDMX), Peru, and Colombia |
**Domestic U.S. Travels aren’t listed
There isn’t much more I can add to this 6.5-year review. The next step is 5.5 more years to go until retirement. I’m sure we will spend at least $1.5 million in that timeframe. Prices are indeed going up.
About Author


