
Lessons on Building Wealth from 2019-2026: Winners and Losers
Real median household net worth in the United States surged by 68% between the fourth quarter (Q4) of 2019 and the second quarter (Q2) of 2026. This rise in median household net worth was largely driven by asset price appreciation. While median income edged up 2.5% in real terms (net of inflation), household balance sheets expanded through two primary asset classes: Equities (Stocks/ETFs/Mutual Funds) and Real Estate (Home/Rental Investment).
Home equity plays a major role in a family’s balance sheet. The median housing value jumped 28% from $320,000 to $410,700 by mid-2026.
The broader equity market also lifted net wealth. From December 31, 2019, to June 30, 2026, U.S. stocks surged, driven by artificial intelligence and corporate earnings. For this period, the S&P 500’s total price return stands at a whopping +132.20%. This represents an annualized return of 13.84%. With dividends reinvested, the total return exceeds +$155%, adding roughly +1.5% more gains annually.
Ironically, this is the same lesson that we’ve experienced before. Ownership trumps inactivity. While your chances of financial success cement sustainable wealth in the long term. Sadly, not learning these lessons will leave your household falling behind.
Table of Contents
Why use Post-Pandemic Time Frame as a Retrospective on Wealth?
Simple answer: Recency Bias. Once I say pandemic, you should be able to think back to March 2020 and all the subsequent changes since. If you don’t recall, think post-Avengers: Endgame, Spider-Man: Far From Home (aka Spider-Man 2), or Jumanji: The Next Level. People were supposedly stuck at home, and masks were everywhere. If someone coughed, they were reported. It was also post-Trump pt. 1 tax changes and the implementation of the SECURE Act 1.0.
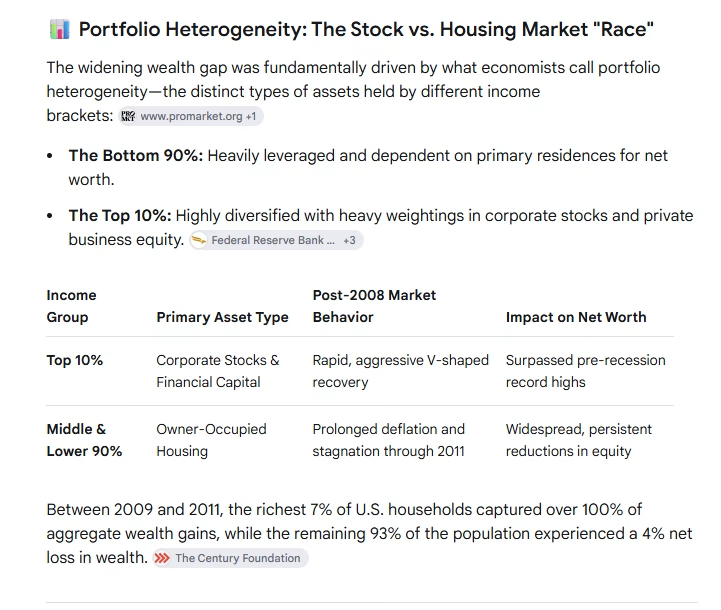
I chose this retrospective after realizing how much wealth changed for various racial and ethnic groups 5 years after the 2008 Housing Crisis. The 2008 housing crisis permanently reshaped the U.S. wealth distribution, wiping out $16 trillion to $17 trillion in household net worth and initiating a “K-shaped Recovery“.
Though everyone was impacted, some people did not let a good crisis go to waste. By 2022, the median wealth gap between homeowners and renters exceeded $390,000.
The 2008 Housing Crisis and subsequent bank bailouts created an uneven economic recovery.
Financial assets (stocks) rebounded rapidly while housing assets deflated. Because middle- and lower-income families hold the majority of their wealth in home equity, the housing crash set their wealth back to late-1989 levels.
Meanwhile, the wealthiest households— diversified into stocks and business equity—capitalized on a booming stock market recovery, consolidating their share of aggregate wealth. To make matters worse, most withdrew from their investments at the bottom of the market. Many never went back.
From Crisis to Crisis: Why the Rich Get Richer!
The post-pandemic landscape created the same environment.
After the initial panic set in, governments around the world moved to provide additional resources and income while a cure was developed. The U.S. unemployment rate peaked at 14.8% in April 2020—the highest level recorded since data collection began in 1948—up sharply from 3.5% in February 2020 just before the COVID-19 pandemic hit. Some capitalized while others fell further behind. Some millennials hit the right moment at the right time.
By buying homes in 2020, buyers locked in sub-2 % mortgage rates while benefiting from the growth of a depreciating asset. Others jumped into the market after stocks dipped 40% to go on to close the year +71.4% by year-end (YE) 2020.
Opportunity waits for no one. The same will hold for the next crisis. Living below your means has its privileges. When times are good, you have to get prepared because challenges are cyclical. Those who were prepared are able to weather the economic storm.
Reviewing the Asset Side of Wealth by Race and Ethnicity
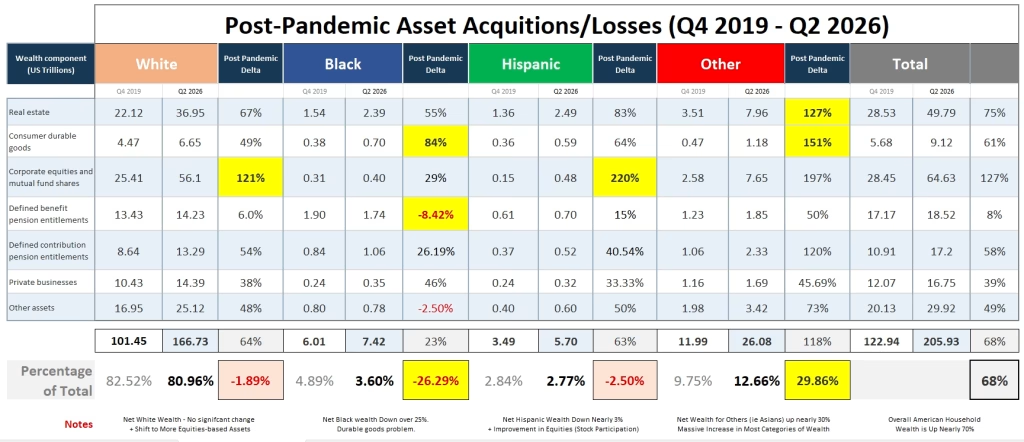
From Q4 2019 through Q2 2026, total U.S. Median Household Assets grew by 68%. That’s about 10% average annually (6.5 years). Even depressed by cumulative inflation since December 31, 2019, of approximately 31.03%, American families netted a robust 7% increase. It might not feel like it, but the wealth hasn’t lost its stride. This was helped by income growth.
U.S. real median household income was $87,460 in 2025, up 2.6% from the previous year. This is the highest on record since 1967, when the U.S. Census Bureau began tracking this measure, according to a new report released September 15, 2026. The more money you have in circulation, the more opportunity you have to spend or invest.
From Table #1, White and Hispanic household assets were up 63% during this period, due to an increased position in corporate equities and mutual funds. Hispanics are buying more homes. Asian Americans (who are thrown into the others) have seen a staggering increase of 118%. With the highest median income of $126,300 (2025), Asian Americans are a dynamic force reshaping the American cultural landscape. Translation: they are overrepresented in top-earning degrees, which leads to a robust acquisition cycle. It’s definitely something to watch as new purchases like real estate add debt.
It isn’t all good news.
Black median household assets are falling behind, with 23% growth. There is a seismic increase in durable goods and a decrease in defined pension entitlements. Pensions are interesting since they are the only assets that you can’t easily transfer to the next generation. This will become a problem later. In the end, Black asset wealth fell 26% as a portion of total US asset wealth, on the tailwind of a spike in Black unemployment and evictions. Black household median income went up 4.8% from 2024 to 2025; however, it trails behind the U.S. Median by 33%.
That part is a mouthful, but it’s not good.
Where does the disconnect start?
There is an inheritance elephant that needs to be addressed. Over $84 trillion to $105 trillion is shifting from older generations to heirs in the U.S. in the next 20 years.
Among households that received an inheritance, Black homeowners had a median inheritance of $20,483 in 2022, according to a March Urban Institute report. White homeowners who received an inheritance had a median of $54,645. Among renters, Black households that received an inheritance had a median of $1,754. The median for white renters receiving an inheritance was $24,554. Sadly, it doesn’t end there. The top 1% of households receive average inheritances exceeding $719,000 up to $2.7 million, while the bottom 50% of recipients average roughly $9,700.
In the 2023 study series from the Federal Reserve Bank of Boston, direct inheritances account for only about 14% of the racial wealth gap. The Limited Role of Intergenerational Transfers for Understanding Racial Wealth Disparities report found that lifetime earnings, homeownership stability, and traditional pension access explain roughly 80% of systemic wealth disparities.
With most wealth depleting by the 3rd or 4th generation, it’s not wealth calcification that’s the problem. Based on the recent Q2 data review, the solutions that Asian American families adopted are to prioritize foundational homeownership to anchor multi-generational stability and maximize investments, especially through retirement accounts.



Debt is not Always a Bad Thing when it comes to Building Wealth
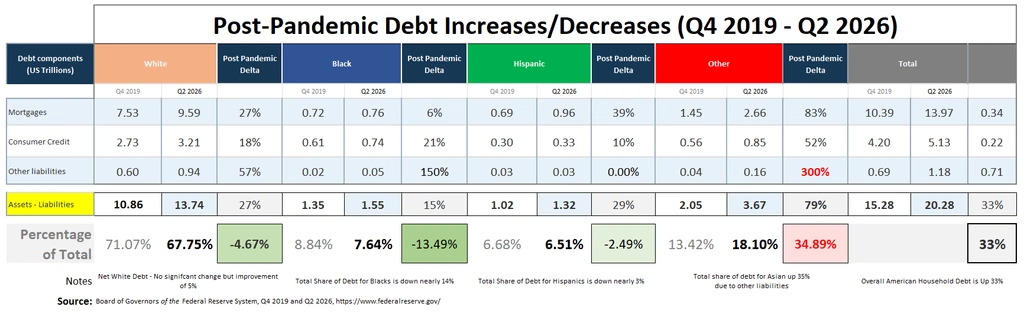
Total U.S. household debt reached $18.8 trillion by the second quarter of 2026, according to the Federal Reserve Bank of New York. This represents an increase of 33% since Q4 2019.
According to Experian, the average American household carries approximately $105,444 in total consumer debt. Some of the average debt (liability) broken down per borrower: Mortgage ($272,628), Student Loans ($37,400 to $43,300), Auto Loan ($25,219), and Credit Cards ($6,610).
From Table #2, total median Other (*Asian) household debt went up 79%, with the biggest category change in “Other Liabilities.” Other liabilities on the Federal Reserve’s balance sheet comprise miscellaneous and residual financial obligations that are not categorized under major headings like currency, reserve balances, or the Treasury General Account.
Hispanic households’ mortgage debt climbed 29% over the retrospective period. White American household debt was in line with the Hispanic, with a change of 27%. Black household debt grew the least, by 15%, while decreasing by 13.49% from the total debt equation. In one sense, that’s good. On the other hand, it’s not. The Black homeownership rate in the United States hovers around 43% to 46%, trailing the White homeownership rate (around 70% to 72%) by a persistent gap of nearly 30 percentage points.
The Algebra of Debt
Consumer debt is not just credit card focused. Debt can be the initial capital for borrowed leverage.
Using debt to build wealth requires leveraging low-interest borrowed money to acquire appreciating, income-generating assets while avoiding high-interest consumer liabilities. Good debt can fund appreciating assets or income generation with low interest rates such as home mortgages, low-rate business loans, and/or student loan debt that boosts income. Bad debt finances depreciating items or discretionary wants at high interest rates.
The core algebra behind leverage is simple. It’s the Spread = Asset Return – Cost of Borrowing. When the spread is positive, debt amplifies your wealth accumulation.
Racial groups in the U.S. interact with, hold, and experience debt differently. Socioeconomic research revealed that these differences are driven by systemic factors, income disparities, and generational wealth gaps, rather than differing cultural attitudes or personal philosophies toward borrowing.
- White and Asian households hold a higher proportion of mortgage debt. Because real estate generally appreciates, this is historically categorized as asset-building debt.
- Black and Hispanic households carry a much higher proportion of consumer credit and installment debt (such as auto loans and credit cards) relative to their total wealth. According to Federal Reserve data, consumer credit accounts for roughly 43.5% of total debt for Black families, compared to just 22.8% for White families.
Post-Pandemic Wealth Surge and Gaps
So what’s the result?
Wealth generation can be complicated. Intergenerational transfers through education, skills, and even faster debt paydown can be critical to your own family’s wealth goals. I would argue the best outcomes come from enhanced education, targeted skills like public speaking and social confidence through sports.
Nothing changes the flow of money quicker than a cash infusion from a family member. No matter if they pay for the student loans, a down payment on a new home, or just pass one +$100,000, that’s more than enough to put you ahead of your peers. That works for the 10% but not everyone else.
For the remaining 80%, long-term planning and classic money management do the trick.
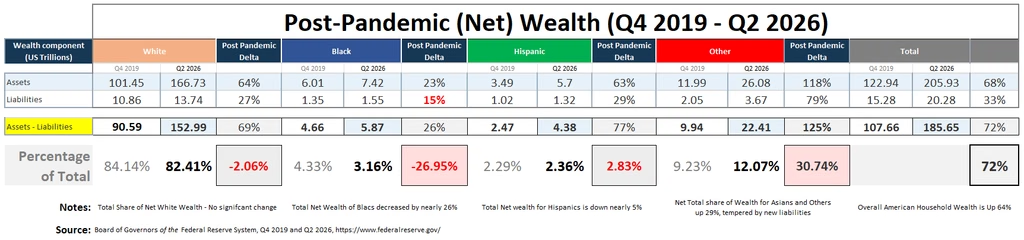
From Table #3, total median wealth increased by 72%. The biggest winners in this wealth equation are Other (*Asian) households. Their net wealth climbed 125% over the last 6.5 years. When their total assets increase by 118%, they can easily outpace your total liabilities and still come out on top. This represents a 30% jump in their share of total wealth. Basically, this is really good.
With the economic drag of new migrants, the Hispanic community is pressing forward. Their wealth shifted by 77%, with a 2.83% overall share of total wealth.
White households improved by 69% but fell by an insignificant 2.06%. The most troubling is black weallth climbed 26% but fell by nearly 27%.
The wealth game is about how much you are moving ahead and how fast, while gauging how much others are doing too. From a running perspective, Asian households are moving quickly and efficiently. Whites are huffing but will finish. Black households are running out of time.
Pseudo-academics and social media influencers say that “Homeownership Is Not a Solution to the Racial Wealth Gap.” Financial personality Grant Cardone said that 401ks are ‘The Biggest Scam‘ in finance, and people believed him. The data doesn’t support these assumptions in theory or in practice.
The Algebra of Wealth
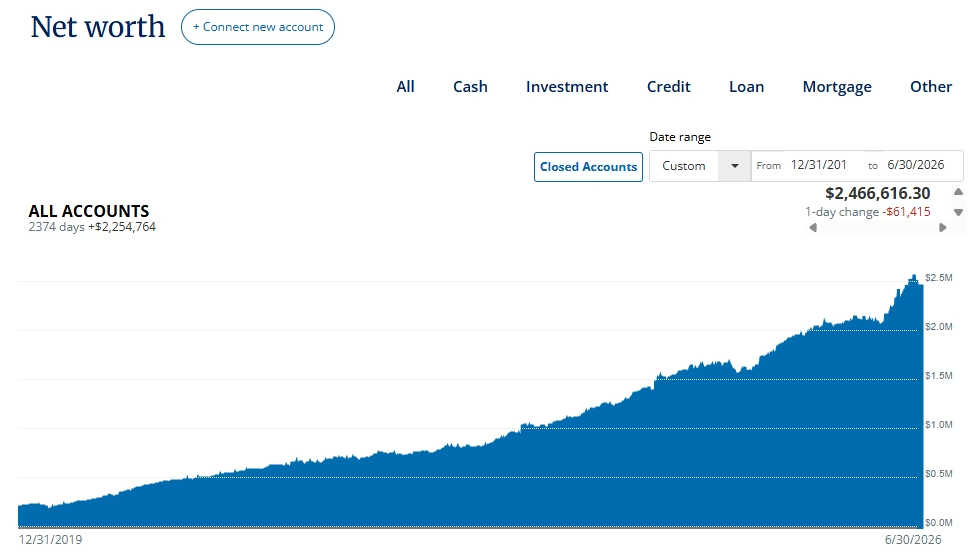
My household increased our wealth by $2M over this time period.
Most of it was blind luck since we lived in an affordable 2/2 paying around $1,000 in housing costs per month. The rest was just good financial practices. This was a massive boon as we were able to use the rest of our earned income to invest and pay off debts. The best part is that we didn’t skip on high expenses from the wedding, a new dog, a new car, and traveling. Money flowed in and out due to emergencies; all to say Financial Literacy really works.
Our investments went from $204,969 (December 2019) to $1,792,016 (June 2026). That’s a difference of $1,587,047 (an increase of 774%). Even net of contributions ($504,807), that’s an average annualized ROI of 81.23%. Accountability, Budgeting, Cash Flow Management, and Discipline aren’t bad terms. They are the ethos for financial abundance, especially when you aren’t starting wealthy.
Money is being made, no matter if you like the cards you were dealt or not.
While I can stay here and opine for longer, I won’t. The solutions are ancient, and the story cycles back. There are actions you can take; you know them. Use them or don’t; the future will be more expensive either way. Most people struggle with purpose and patience.

About Author


You May Also Like

A TFG Short – Why Do People Hate Lawrence All the Time?

If You Think It Costs A lot Today, Check Out These 2030 Estimates