
A Study Found that Thriving U.S. Families Need to Make $150K a Year. Where Do You Fall?
The recent study, Measuring the True Cost of Economic Security, conducted by the Urban Institute, found that a well-off household needs to make at least $150,000 annually. The news hit social media like an expected tidal wave. This economic security threshold reminds us that the cost of living in the U.S. has ramped up dramatically. As the U.S. loses its political standing, along with the global increase in middle-class standards, the future is more expensive.
U.S. households are already feeling the squeeze. Many of whom are surviving on less than $80,000 per year. Based on 2024–2025 Census Bureau data, median household income varies significantly by race. Asian (-led) households earn the highest median income at roughly $116,503. White households are listed as earning $83,730. Hispanic and Black households earned $70,950 and $55,157, respectively.
The $150,000 number represents the K-shaped line between Thriving and making the most of opportunities versus surviving and getting buried under debt. This imperative accounts for favorable geographic locations, amazing amenities, luxury perks, housing, quality food, competent childcare, great healthcare, transportation, taxes, and a modest amount of savings.
There is a noticeable difference between a community like Bethesda, Maryland, and Mobile, Alabama. It’s night and day; all of which extends to life expectancy.
Table of Contents
Net of Tax – Thriving or Nah
The average American household brings in around $80,000 pre tax and saves less than 7 percent annually. At this rate, most will be insolvent by age 52 and will have to work through the age of 70 to break even. That’s the result of a lifetime of surviving. As of February 2026, the average monthly Social Security retirement benefit is approximately $2,076.41. While median data specifically is less commonly cited than the average, this average represents the typical monthly check, which equals about $25,000 annually, for retired workers. Frankly, it’s not enough.

Accounting for the median total tax rate of 15.9 percent, that’s a large take-home of $126,150. These families would also need to account for 25 percent savings/investments annually (at least $30,000).
Over the period of 30 years investing at 8 percent, even $2,500 monthly would accrue to a sizeable $3.5 million investment portfolio. Enough to live off $140,000 annually with the 4 percent withdrawal rate. Unfortunately, the median household has less than $70,000 in savings (which includes checking, bank savings, and equities).
Net of taxes and savings, thriving households will need to live off $94,612.50. After nearly 60 percent is allocated for housing, transportation, and food, they are left with $37,845. This [Net/Max] budgetary equation is workable for most areas in the U.S. But it only works if you are willing to put investing at least 25 percent of your gross income for your future first.
73.9 percent of American households fall below Thriving
According to the 2024 U.S. Census Data, the median household income for Black families was $54,967. That’s nearly 41% less than the $92,530 median for White households. This gap widened from the previous year. Hispanic households pulled in a median income of $70,950, which Asian American households edged out further ahead with $121,700.
Nearly 57.3% of American Households make less than $100,000 a year (pre-tax) while contending with approximately $85,000 in annual household expenses.
By no uncertain terms, Americans are barely staying afloat. Unfortunately, costs will only spiral upwards as Americans compete with rising middle classes in China, India, Brazil, and South Africa.
Income is only part of this story.
Research has consistently shown that the American home held less than $200,000 in median wealth (2022). This wealth number is primarily centered on their home value. Based on my estimates, the national median wealth should climb to $247,500 with the upcoming 2025 data set from the Federal Reserve of St. Louis’ Survey of Consumer Finances. It stands to reason that Asian American households’ median wealth should exceed $690,500 (est. 2025), with White households at $355,000. Hispanic and Black households are still lagging with $78,994 and $53,840, respectively.
To put it bluntly, Black families (the demographic with the lowest net worth) have 12x less wealth than Asian families (the highest net worth). An estimated 32 percent of Black households have zero or negative net worth (Census.gov). A significant portion of Black wealth, close to 50 percent, is concentrated in home equity, making it less diversified compared to other households that own higher shares of stocks.


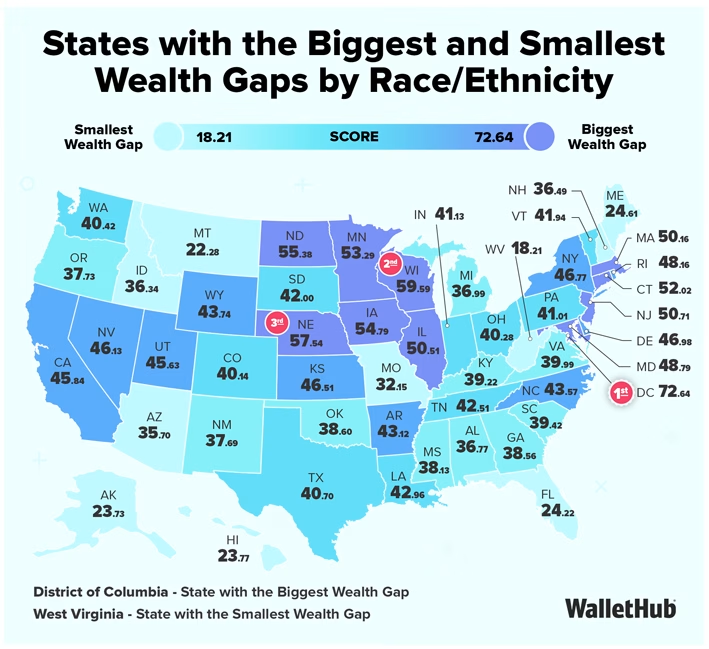
Wealth inequality also varies by location
Thriving in New York City, NY (2025)?
The racial wealth gap in New York City is extreme. The median total wealth (assets minus debts) held by Asian, Black, and Latino New Yorkers (at $43,100, $2,800, and $0, respectively) is dwarfed by that held by white New Yorkers ($320,000).
The median total assets (not including debts) for white New Yorkers is also substantially greater than that of Asian, Black, and Latino New Yorkers ($420,500 vs. $81,800, $10,100, and $1,800, respectively).
Miami, Florida (2025)
According to WalletHub, Florida has one of the smallest racial wealth gaps in the U.S. However, the data carries massive disparities by city.
White families in the Greater Miami area have an estimated median wealth of $107,000, Black households have a fraction of that, at just $3,700. Puerto Rican households in Miami often show negative median wealth (-$3,900), while Cuban households, though having higher wealth than other marginalized groups in the area, have $22,000.
Surviving in Atlanta, Georgia (2025)
Wealth inequality in Atlanta, Georgia, remains extreme as of 2025.
White households hold roughly 46 times more wealth than Black households ($238,355 vs. $5,180). This gap is escalated by a racial income disparity ($131,319 vs. $47,937), driven by historical discrimination, lower homeownership rates (17.4% Black ownership), and limited generational wealth. 45% of Black Atlantans have delinquent debt (vs. 21% of white Atlantans). A staggering 72.8% of the city’s black population lives below the federal poverty line ($15,650).
Houston, Texas (2025)
In the city of Houston, white and Asian households are significantly more likely to be financially secure than Black and Hispanic households. Median income is highest for White households ($87,529) and lowest for Black households ($46,230). Black residents reported student loans as their largest debt, while white respondents reported higher balances in car loans and credit cards.
Los Angeles, California (2025)
Wealth inequality in Los Angeles (LA) remains profoundly split by race, with white households holding a median net worth of $355,000. Mexican and U.S.-born Black households have a median net worth of just $3,500 and $4,000, respectively. While Black wealth is increasing, systemic gaps in homeownership and employment also persist.
The median household income in Los Angeles is highest for white households at $99,345 and lowest for Black households at $52,612. Black residents in LA County face the highest rental burden (65%) and high eviction rates, while mortgage acceptance rates for Black families have fallen to 51%, hindering homeownership.
The Ineffective Single-Income Unit
The Urban Institute’s report on the True Costs of Economic Security noted that single-parent households have among the lowest rates of economic security, with about 90 percent falling below the $150,000 threshold.

Black mothers have the highest rate of single motherhood at 47 percent, followed by Hispanic (25 percent), white (14 percent), and Asian mothers (8 percent).
Approximately 67 percent of Black children in the U.S. live in single-parent households. Based on early 2026 data, Black women working full-time in the U.S. have median weekly earnings of approximately $964. This translates to a median annual income of roughly $41,225.
These earnings vary significantly by age, education attainment level, industry, and geography. Shockingly, only 28 percent of Black women make more than $50,000 per year, compared to 54 percent of Black men.
Renters are getting hit hard
About 80 percent of U.S. renters fall below the economic security line. This represents nearly double the rate of homeowners. Black homeownership sits at just 48.3 percent, compared to 50 percent for Hispanic households, 63 percent for Asian households, and 71.6 percent for White households.
With the median rent for a 2-bedroom, 2-bath rising (between $1,343 and $1,901 per month), renters are more likely to pay a higher share of their income toward housing. This directly contributes to being less likely to build equity.
Additional Financial Burdens: More Mouths to Feed on Less Income
In addition to these burdens, lower-income households are more likely to be trapped in a downward generational debt spiral. They are less likely to receive an inheritance and more likely to support their aging parents.
The average inheritance clocks in at around $45,000. This figure is skewed in favor of wealthy households. 75 percent of households will receive no inheritance. Most often, the bottom 50% of households receive less than $10,000 (which generally covers funeral costs) while the top 1% racks in over $720,000. If that wasn’t enough, the quiet intergenerational support drains household budgets that are already running on empty.
Three out of four Black households aged 50-64 have less than $90,000 in savings, often forcing reliance solely on Social Security. As of late 2025, 74% of Latino/Hispanic households are at risk of being unable to afford basic living expenses in retirement, a higher percentage than other demographic groups.
Black and Hispanic millennials should expect to spend at least $2,000 per month supporting their parents through their retirement years. Over the course of 20 years, that cost will balloon to at least a total of $500,000. That monthly support, amounting to over 20 years, at a 9 percent rate of return, would have netted a robust investment portfolio of $1.28 million. Of which $797,703 would have been interest accrued. Time and family equal money earned or spent.
A K-Shaped Society: Surviving versus Thriving
The study’s author framed “the $145,000 number not as aspirational but as the point where people can feel like their work is paying off.” The threshold includes basics like housing, food, and healthcare. It also accounts for the ability to absorb unexpected expenses ($2,000) and to save for retirement. Thriving can be summarized as living beyond the fear of not having enough money.
For Hispanic and Black families, particularly, navigating a median income that falls nearly $90,000 short of the thriving benchmark is nearly impossible. Without a seismic change in family planning, direction, and governmental policies, most household finances are fixed in survival mode.
Currently, the federal poverty line for a family of four stands at about $33,000. After helping with some tax returns this year, I’m not sure how people are getting by on less than $50,000. Their world, from my vantage point, seems small and constricting. Growing up poor, “No” was the default response. For families similar to mine, kids go without adequate physical and mental nutrition. This can leave many as malnourished adults who are unable to compete or adapt.
Thriving is a lot more complex
For families, it means being able to gear up their kids from day 1. Grandparents and other family members should be a pool of forward initiatives like swimming lessons, 529 plans, and other formative speech/learning initiatives. After the initial years, it’s who is picking up the kids. The ease of communication and value of babysitting for short days or weeks. Finally, education should never be second-rate. It’s all or nothing. Thriving is about going the distance and setting the family up for a brighter future.
There is a massive difference. Growing up in poverty or extreme low income (sub $20,000 in the 90s) to making $300,000 (as a married dual-income household in 2026), I feel the difference. You no longer need to do mental math at the grocery checkout aisle. Your weekends are more enriching, and your experiences are now global in scope. It’s not about spending money. Instead, it’s about enjoying opportunities and leveraging personal growth. Surviving is languishing that you wanted to say “Yes“, Thriving is living with the power of saying “No, I’ll pass.”
The best solution is for those who know how to pave the roads, at least for the next generation. If you liked this article, check out How a Great Budgeting Plan Can Help You Live Off of $112,000 Per Year for the Rest of your life.

About Author


