
How to Build Wealth: Reviewing Our Nearly $1.4 Million in Investments
While we aren’t quite there yet, my wife and I took a step back to review our investment portfolio performance over the last 12 months. It was intriguing to see the progress. While the day-to-day news cycled through inflation fears, tariffs, market pullbacks, and even a Middle Eastern conflict, we stayed invested. It was a crash course in discipline, risk tolerance, and sometimes buying the dip while it kept dipping.
In the end, our investment portfolio grew from $948,927.51 (April 1, 2025) to $1,398,505.46 (April 9, 2026). That’s a cash value increase of +$449,577.95 or +47.38%. That number is phenomenal, and the growth is solid. Being honest, too much growth gives me heart palpitations. It’s great, but it’s something to get used to when investing thousands on a whim.
While I’m not yet confident enough to think we can duplicate this element, it was still great to dissect it a bit. The funniest part is that even if I primarily do the investing for us, my wife’s Fidelity performance still exceeded mine. She really has a knack for beating me at anything, even the stuff that I teach her, like Magic: The Gathering. But then again, she is hypercompetitive.
As always, we post to document our progress and to learn from what we are doing right financially or what we are doing wrong. If it helps you get a better perspective, use it.
Table of Contents
The Investment Portfolio Overview
My wife and I have been investing together since January 1, 2020. At the time, we started with a total of $204,969.41, but we quickly maxed out our 401(k)s, IRAs, and HSA investments. While the contribution amount changes annually, we kept investing as our top priority. We did that mainly for the tax benefits from deferral to tax-free growth.
Our 401(k)s are likely the more standard growth element since they are tied to the S&P 500 (generally), while the rest are a bit more touch-and-go.
I don’t have the range to explain it, but my gut instinct tells me that IRAs need to be more aggressive when and where possible, especially since they have the tax-free growth component.
As of April 9, 2026, our total investment portfolio breaks out as:
- 401ks $505,352.58
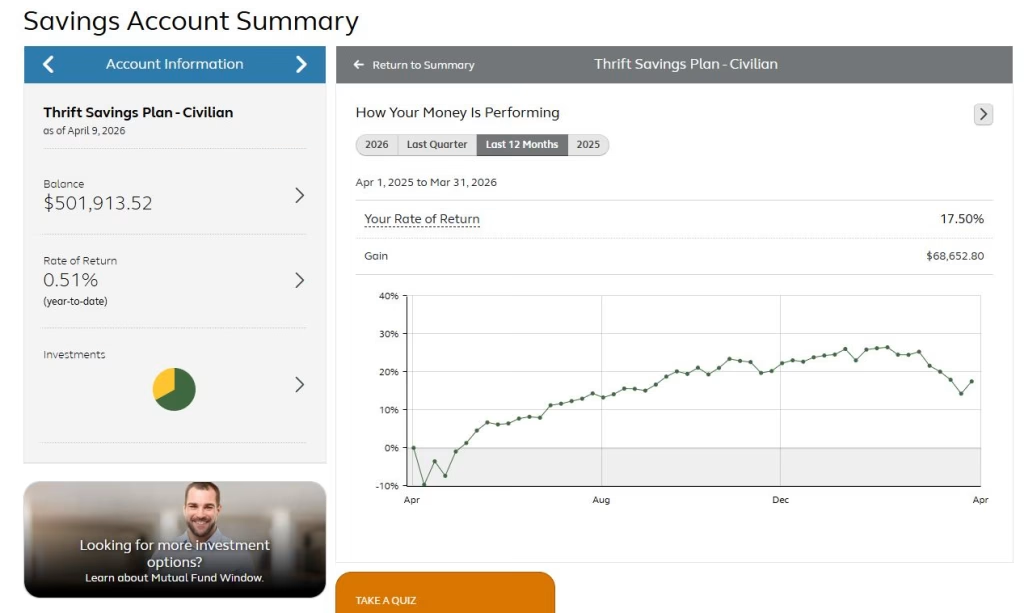
- Mr. 401k $501,913.52
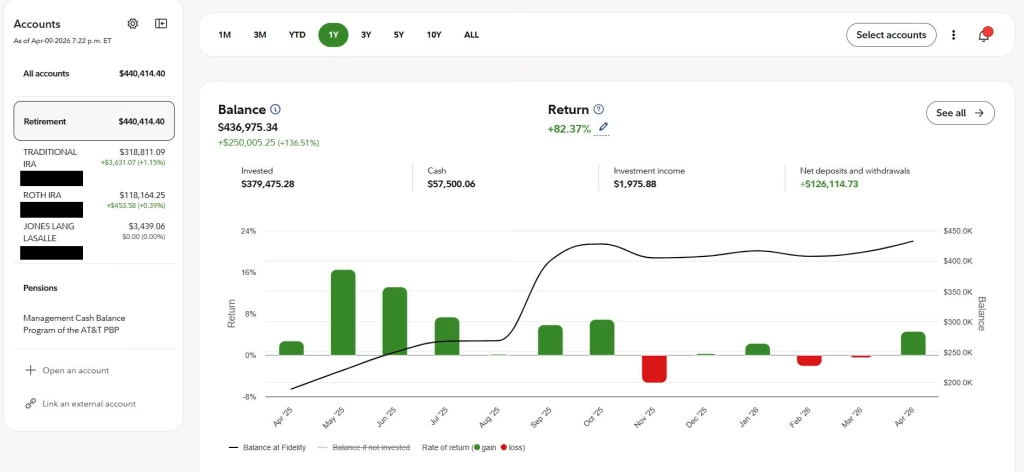
- Mrs. 401k (new) $3,439.06
- Mrs. Traditional IRA $318,811.09
- Roth IRAs $283,829.60
- Mr. Roth $165,665.35
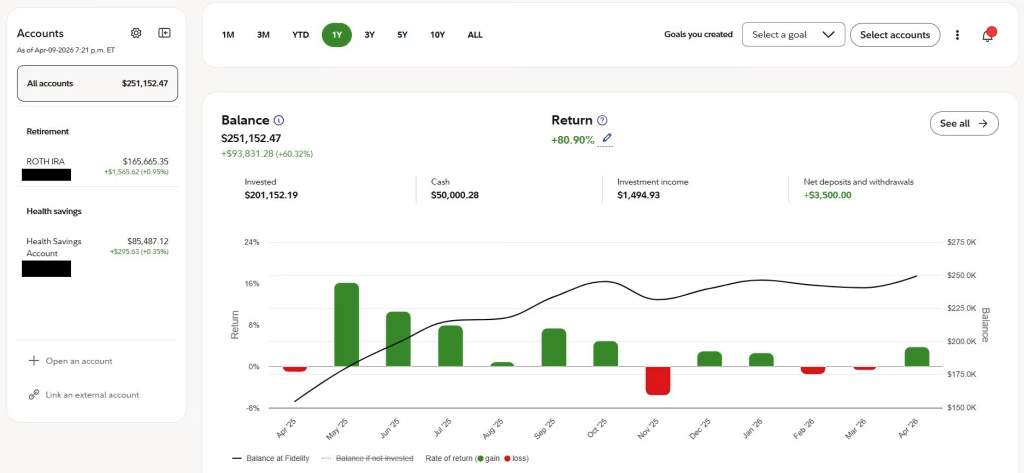
- Mrs. Roth $118,164.25
- Mr. HSA Investments $89,861.59
- Account #1 $85,487.12
- Account #2 $4,374.47
- After-tax brokerages $200,650.60
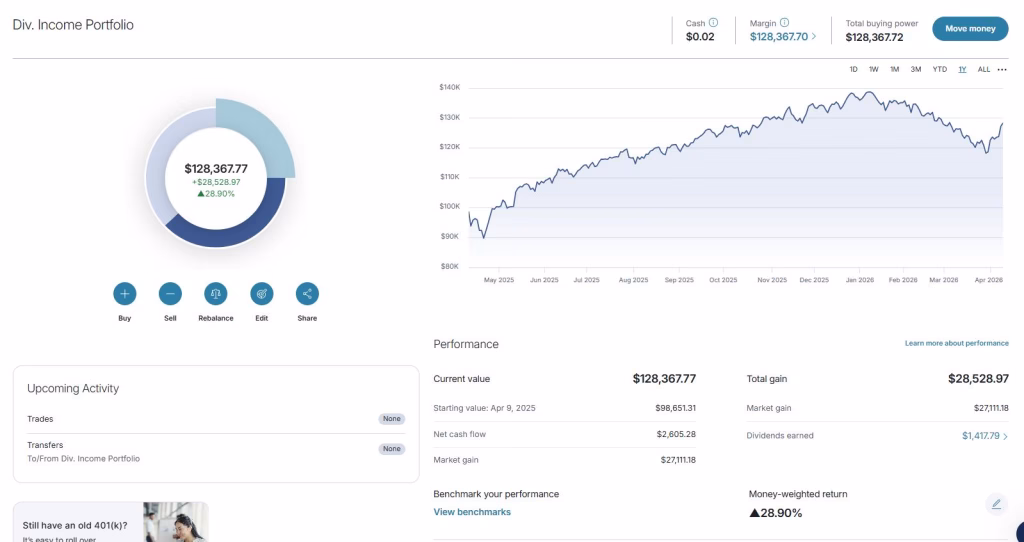
- Account #1 $128,367.77
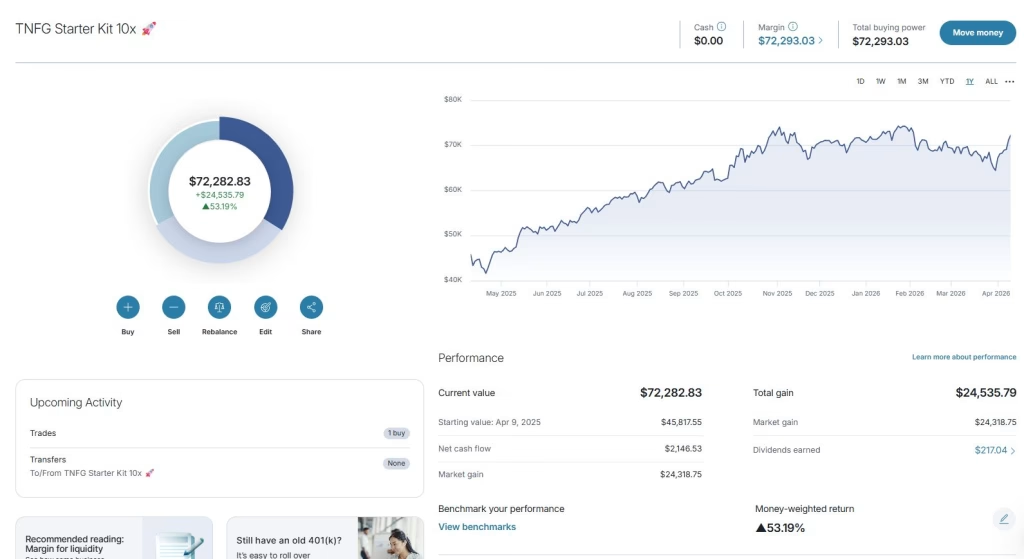
- Account #2 $72,282.83


The growth for the last 12-Months
We’ve been moving and shaking even with the market downturns. It comes down to guessing and price action. Again, this doesn’t mean that I can readily duplicate this performance, but the idea is there. That part is easier to show in the next few graphics.
Outside of the one HSA for $4,374.47, not seen here due to the other platform (HSA bank), it was cool to see what we did overall. To not drag this post too long, the S&P 500 index grew by 37.84%, and the DOW by 38.57%. As you will see below, some of our portfolios exceed 50% growth for the same 12-month period.
*Welp, time to see what we can do for the next couple of years. Since people ask, you can always track our full portfolio on Google Sheets. Well, back to working the 9-5 to earn these contribution dollars.
About Author


