Another Great Year for Investors, All Things Considered
For the third year in a row, our total household investment portfolio beat the general market. 2025 started promising and landed in a heap of tariff trouble, recession worries, and AI bubble speculation. Liberation day didn’t help one iota. Yet investors came out on top, with nearly 17% returns. Well, this win is mainly applicable to those who didn’t sell out of fear. For the last five years, our portfolio returned +109.73% compared to the S&P 500’s +78.29%. That’s an annualized growth rate of 36.57%, which we really could have done better with, but who’s counting?
Once more, everything from cash to real estate made money.
Three sectors led this growth momentum. The industrial sector came in third place with 19.5% gains. Followed by the communication sector with 23.5%. Information technology (aka Big Tech) clutched a narrow win at 24.6%. U.S. inflation in 2025 finished at 2.7% as of December, down from 2.9% at the end of 2024. Consumer sentiment flatlined. Inflation may be cooling, yet it remains elevated. This economic environment is cementing the decline of the Middle Class.
The identity of the “Split consumer” is growing, one who feels that America is working for them, and the other who doesn’t understand the world. This is why you are hearing an uptake of “Affordability” and “K-Shaped Economy.” People really have to invest to keep up with their lifestyle. The more expensive your taste, the higher the cost. And the more you should invest.
Table of Contents
The Future in the Far East with Surcharges
The era of American Exceptionalism is waning. Solid stock returns combined with a weakening U.S. dollar meant that international stocks outperformed quarter after quarter.
Try not to worry too much.

The U.S. is still the biggest consumer in town. Besides, we have at least two decades until the world order shifts to China. In 2025, China met its 5% target growth rate, compared to America’s 2%. China’s trade with the US dropped by nearly 30%, but was offset by increased trade with other regions. Ironically, China’s growth was driven by resilient exports, reaching a record $1.19 trillion surplus despite U.S. tariffs.
And where did those tariffs go?
They were absorbed by consumers globally. Prices aren’t just up in the U.S.; everyone is feeling the shift. Recent analysis indicates that tariff policies implemented during the Trump administration cost the average American household approximately $1,000. All things considered, that’s less than $90 per month.
Despite these challenges, India’s economic growth remained resilient, while Brazil experienced a massive boom in tourism dollars. BRICS (including new members) experienced robust average economic growth of 3.8%, significantly outperforming the G7 nations. Total bloc trade surpassed $1 trillion USD, with a chance that they will account for 60% of global trade by 2032.
Approximately 1.5 billion people worldwide are actively studying a foreign language at any given time. I’m picking up Japanese. The world is in transition. If you can’t communicate, you will forever be at a disadvantage.
As the world’s middle class grows, so do prices. It’s all supply and demand; limited supply, higher demand = higher prices.
The future is more expensive. To counter, Invest!
Until the inevitable happens, we are making money wherever possible.
American investors have experienced a historically strong decade, with the S&P 500 generating roughly 240% in total returns (approx. 11–13% annually) between 2015 and 2025. Growth-focused portfolios, particularly those in the Nasdaq Composite, saw gains up to 336%. By all metrics, investors are wealthier.
The geographic limitation won’t apply as much in the future. Due to the proliferation of social media, people are seeing the new American Dream: build wealth domestically (20-30 years) and live globally.
America’s main exports aren’t Hollywood and sports anymore; it’s our financial banking system and our stock market. There isn’t a future where capitalism isn’t relevant, and companies that aren’t profitable.
Unfortunately for the average American, the news is the current colosseum showing. The ‘rage bait du jour’ is incredibly expensive for their future.
While the stock market has grown by over 77% in the last 5 years [S&P500 as of 2.10.26], nearly 90% are losing growth is being eaten away by inflation at 25%. What used to cost $100 in early 2020 now costs about $125.
If the 2020 median household expenses of $61,334, the 2025 expenses should be over $80,000. Again, this shouldn’t be surprising with the growth in demand for limited goods while labor costs increase. To make matters worse, approximately 27% to 45% of baby boomers have no dedicated retirement savings. Many rely solely on Social Security. As their savings run out, their families will be on the hook to support them for the next 10-20 years.
Even without the sandwich generation tax, by 2040, the median household will need to spend around $125,000 to maintain its current lifestyle. Investing $1,000 per month for the next 15 years would give anyone a fighting chance. The end balance would be close to $500,000.


The Simple Math of Wealth-Building
For 2025, I received three cash awards [totaling $3,217 (pre-tax)]. At the most, I pocketed $2,000 when it hit our bank account, with each dollar coming in clutch for emergencies. All things considered, bonus money is always nice to have, but it pales in comparison to what happened in my TSP (government 401k).
My 401k gains for the year totaled $104,974.47. Excluding my FY25 contributions (of $23,466), this amount netted $81,508.47. This is far more than $3,217. How much more? Over 25 times more. As a proportion of my gross salary, those gains are 57.94%.
To make this even more shocking, our total household investment portfolio grew by $339,008.61. Excluding our contributions (of $65,000), we still net $274,000. In other words, that’s over $5,250 per week. That’s a lot of money and even more reason for people to take investing seriously.
This is why I discuss my household’s investment returns both for transparency and educational purposes.
Approximately 62 percent of U.S. adults own stocks. Less than 40% of Black American households owned stocks (directly or indirectly). While this amount is up from 33% in 2016, this share of ownership represents just 1.4% of the total equity market value. This is a recipe for black economic collapse by 2040. To put it plainly, the typical Black household holds around $16,500 in stock holdings and about $5,500 in other financial assets.
Although difficult to overcome, it’s still not impossible given time, values, and effort. We started with zero back on January 1, 2014, and still managed to hit over $1 million as of 2025.
Our Total Investment Portfolio Doubled Over Two Years?
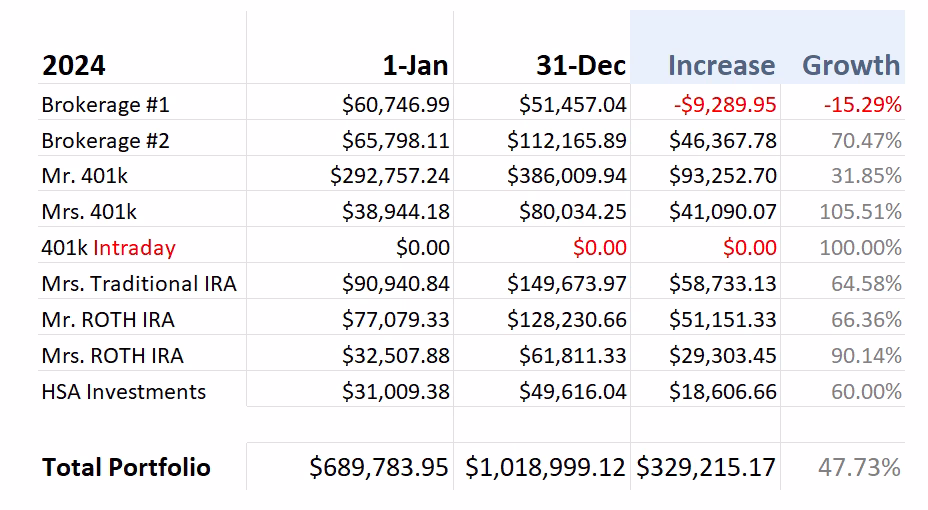
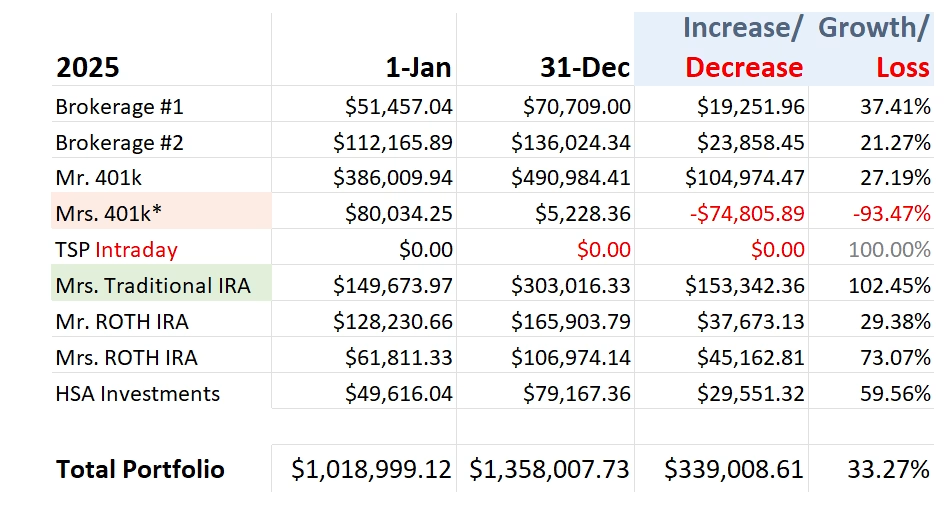
For clarity, Mrs. TNFG changed jobs, prompting us to complete a tax-free rollover from her 401 (k) to her Traditional IRA. It looks like a loss, but it isn’t. Other points to note: our 401 (k) s stick to retirement-dated funds. This leaves our IRAs to be more aggressive. Although I place our investments, she somehow manages to beat me anyway.
What’s cool about this look back is that we nearly doubled in two years.
All about the Allocations
As a reminder, our portfolio (asset allocation) is 90/10, as follows:
- 95% Stocks: 90% US Stocks, 5% International Stocks
- 2.5% Alternatives
- 2.5% Cash
We were still Tech-heavy at 40 percent and low in Utilities at 1.1 percent. Per Empower, we could decrease our US stocks by $454,000 and Unclassified by $23,800. With the surplus, we would have to rebalance into international stocks ($220,000), US Bonds ($141,000), Alternatives ($95,400), and International Bonds ($27,600).
Good ideas, but I’m not doing it for now. Don’t U.S. companies already bring in at least 40% of their revenue internationally? It can be argued that we are already diversified. But what do I know?
Portfolio Performance and the Long-Term Game
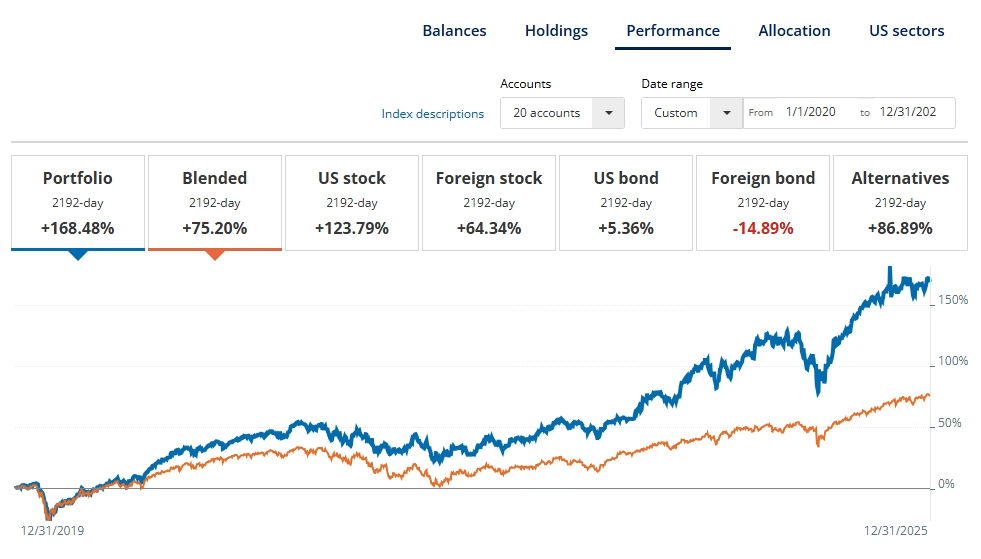
The performance of our overall investment portfolio for 2025 was 33.27%. Excluding our contributions of $75,000, it comes down to 25.90%. Since we started investing (together) in 2020, our annualized returns have been 28.08 percent. This is higher than the S&P 500’s 18.64%. We are aiming to improve our performance while keeping at least 10% cash-on-hand.
The market is fickle. This means you need reserves on the side to jump in for sales and overreactions.
If you want to follow our investments, they are available via a Google Sheet. I threw in even my stock predictions that I update at least monthly.
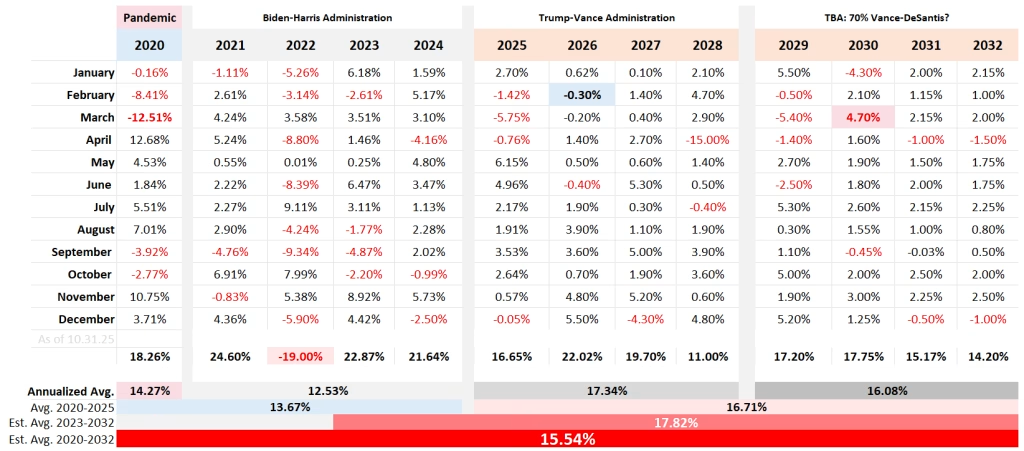
The 2026 stock market outlook is generally bullish, with Morgan Stanley projecting 14 percent to 16 percent. All eyes are still on growth driven by AI, potential policy shifts, and easier monetary conditions.
The S&P 500 is expected to continue rising—with forecasts pushing towards 7,800—driven by robust U.S. corporate performance. I guess that Q1 and Q2 will be choppy with the wave in Q3 and Q4. We will touch 8,000 and retreat to 7,750 for the S&P.
Either way, success in investing is measured in years, not moments. Besides, the future is more interesting this way. I like my odds.
About Author


